Relaxation Method
Let us have a look at the following initial value problem with linear operator L:
$$L u(x)=f(x),\:\:\:\:\:\:\:\:\:x \in [x_0,x_1]\:\:\:\:\:\:\:\:\: u(x_0)=u_0\:\:\:\:\:\:\:\:\: u(x_1)=u_1$$
with pseudo time integration one can rewrite it as:
$$
\dfrac{d}{dt} u(x)=(L u(x)-f)
$$
A stationary solution to the above equation is also a solution of \(L u(x)=f(x)\). If we initialise the problem in a random state \(u(x)\) it will relax to a stationary solution if integrated over time.
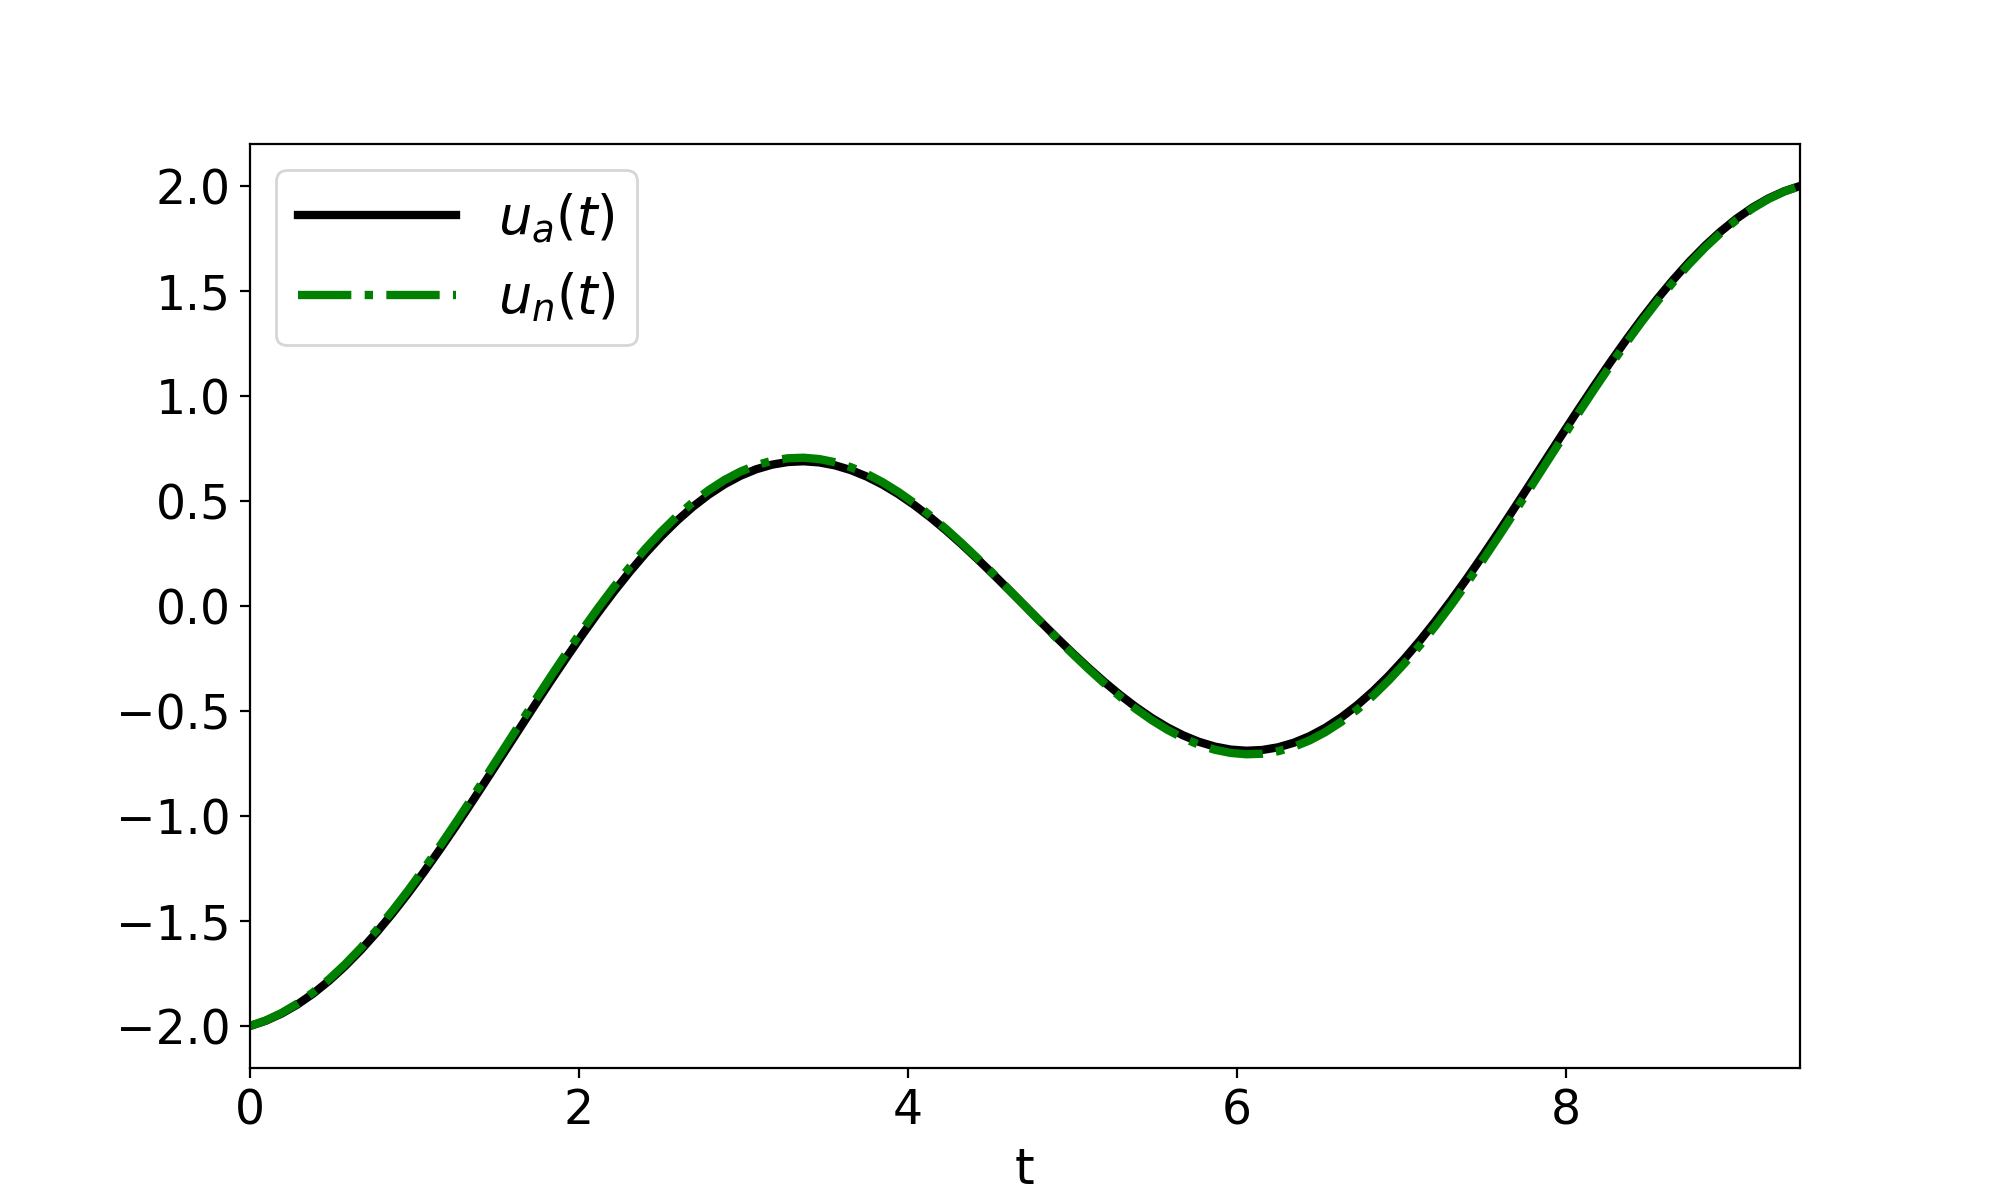
Figure 1: shows the comparison of the analytical solution with the numerical calculated result for the operator \(L=\dfrac{d^2}{dx^2}\), \(f=\cos{(x)}\) in \(u\in [0,3 \pi]\) with \(u(0)=-2\) and \(u(3 \pi)=2\).
"""
The code below was written by https://github.com/DianaNtz and
is an implementation of the Relaxation methods.
"""

#import libraries
import numpy as np
import matplotlib.pyplot as plt

#Finite Difference Derivative second order
def d2x(f,x):
    dx=x[1]-x[0]
    nx=len(x)

    Dxx=np.zeros((nx), dtype='double')

    for i in range(0,nx):
                 if(i==0):
                     Dxx[0]=(f[2]-2*f[1]+f[0])/(dx**2)
                 if(i==nx-1):
                     Dxx[nx-1]=(f[nx-1]-2*f[nx-1-1]+f[nx-1-2])/(dx**2)
                 if(i!=0 and i!=nx-1):
                     Dxx[i]=(f[i+1]-2*f[i]+f[i-1])/(dx**2)
    return Dxx
#create grid
xmin=0
xmax=np.pi*3
Nx=100
x=np.linspace(xmin,xmax,Nx-1)
f=np.cos(x)


#initial guess
un=-np.zeros(Nx-1)

#pseudo time integration loop
dt=0.001
for j in range(0,4000):
    un=dt*(d2x(un,x)-f)+un
    un[0]=-2
    un[-1]=2
#analytical solution
ua=-np.cos(x)+2/(3*np.pi)*x-1
#plotting results
ax1 = plt.subplots(1, sharex=True, figsize=(10,6))
plt.plot(x,ua,color='black',linestyle='-',linewidth=3,label="$u_a(t)$")
plt.plot(x,un,color='green',linestyle='-.',linewidth=3,label="$u_n(t)$")
plt.xlabel("t",fontsize=18)
plt.ylabel(r' ',fontsize=18,labelpad=20).set_rotation(0)
plt.xlim([xmin,xmax])
plt.xticks(fontsize= 17)
plt.yticks(fontsize= 17)
plt.legend(loc=2,fontsize=19,handlelength=3)
plt.savefig("relax.png",dpi=200)
plt.show()
References
[1] https://en.wikipedia.org/wiki/Relaxation_(iterative_method)
[1] https://en.wikipedia.org/wiki/Relaxation_(iterative_method)